
Nedanstående text är ett universitetsarbete som gjordes under kursen "Projekt i ekologi 1", vilket är en kurs man kan läsa under sommaren för att göra ett kortare projekt som skall motsvara heltidsstudier under 4,5 veckor. I detta skall någon slags fältstudie utföras och rapport sammanställas. Rapporter som denna skall följa ett visst mönster: Inledning, Material och metod, Resultat, Diskussion och slutligen Referenser, och allt ska skrivas på ett sådant sätt som gärna uppfattas som torrt (och ofta svårläst för den som inte är van att läsa vetenskapliga artiklar).
Detta projekt kom jag i kontakt med då jag blev tillfrågad om artbestämning och en snabbinventering av grodor i ett forskningsprojekt på Umeå universitet. Projektet gällde näringsflöden från vatten via grodor, där ett flertal olika saker mättes och kollades. Min del var att sampla och sammanställa hur vattentemperatur och löst organiskt material (DOC) påverkar utvecklingen av grodyngel, utifrån de förutsägelser som IPCC har publicerat. Jag kom fram till att yngel utvecklas snabbare, och går upp på land lättare, vid varmare temperatur (inte så förvånande). Det mer intressanta resultat var att DOC hade en påverkan på yngels uppstigningsvikt, men enbart i kallt vatten.
Denna artikel är främst till för att ge andra intresserade tips och idéer om vad man kan göra för herpetologiska projekt. Arbetet i sig är av väldigt praktisk natur, så det är inte mycket fokus på själva skrivandet (till stor del eftersom samplingen + sammanställning av data åt upp det mesta av tiden...). Detta återspeglas i den tveksamma rapporten vad gäller formalia, referenser, diskussionen och den minimala introduktionen... Men detta är just ett skolarbete (som dessutom skrevs för 1½ år sedan), där fokus som bekant inte låg på rapporten (utan fältarbete), så tänk på detta när ni läser den. Jag har sneglat igenom och försökt hitta konstigheter, men det finns säkerligen stavfel, konstiga meningar, och allt som hör till skolarbeten. Slutligen blir det lite svårläst när tabeller och grafer överförs från dokument till terrariedjur.se, vilket ni också får ha överseende med.
1 Introduction
The amphibians of today are constantly under threat from several fronts (Collins and Crump 2009, Alford 2011). At least 37% of the known 6894 species of amphibians are classified as vulnerable, endangered or critically endangered (Alford 2011).
While the most widespread extinction event of our time rages on, changes in our climate become more and more obvious (Bernes 2007). In order to predict the future of the amphibians we need to understand how different factors associated with climate change might affect their growth, development and survival. Since the larvae of anurans live in aquatic systems, properties such as water temperature and dissolved organic carbon (DOC) and their effect on tadpoles should be examined. This becomes even more important since these properties risk changing with the climate change (Laudon et al. 2013, Tian et al. 2013). Therefore this study tries to conclude whether water temperature and DOC affects tadpole development and emerging weight of Rana temporaria.
Materials and methods
2.1 Experimental setup
This study was conducted at 16 man-made ponds, set up by scientists at Umeå universtity, near an agriculture field in the city of Umeå (figure 1). The pond's surface area measured 8 x 10 meters and had a depth of 1.8 meters. All ponds were surrounded by a fence to ensure frogs did not escape their own pond. The ponds were divided into four categories in regards to the water temperature and DOC-levels; Ambient/heated +4 degrees, and clear water/ humic water. These categories will be labeled as "Warm" or "Cold, "DOC" or "Non-DOC" throughout the paper. The heated ponds maintained a water temperature at 4°C above the ambient temperature, so the difference between the cold and warm ponds was constant. The temperature increase of +4 degrees corresponds with the predicted warming in northern habitats (Bernes 2007). The ponds with clear water (Non-DOC) were filled with tap water. The DOC-treatment were filled with humic water from a nearby river, so that the DOC-levels were approximately twice that of the Non-DOC ponds. In all other aspects, the ponds were identical. This resulted in 4 replicates in 4 different categories. However, only 3 replicates in the "Warm, Non-DOC"-category were used since pond nr. 5 became contaminated with frog eggs from a wild population. All ponds were designed to replicate the natural habitat of the study species, which includes zooplankton, macro invertebrate, phytoplankton, algae, bacteria, and lastly, one species of fish (three-spine stickleback (Gasterosteus aculeatus)) (Wells 2007).
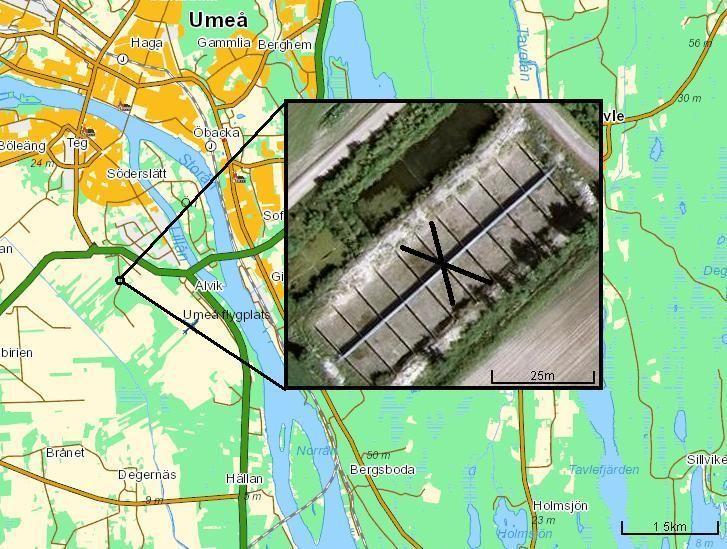
Figure 1. Map of the study site with the 16 ponds. Unused ponds are marked with an X. Coordinates: 63.809444N, 20.2425E.
2.2 Method
Eggs of Rana temporaria were collected from a pond in Mariehem and raised in the laboratory to free swimming tadpoles (Gosner stage 23 (Gosner 1960)). This study used the very same individuals, which were placed in the 16 ponds. When the frogs started to emerge (at the 14th of June), my project began. This was done every day between the 14th of June to the 12th of July, and after that every other day until the 29th of July. Sampling was done by walking back and forth along a pond's edge, collecting every frog at Gosner stage 44 or more. The frogs were then euthanized with a MS-222 solution, and stored, in a freezer, in a bag with frogs from the same day and same pond. All bags were then weighed and the number of frogs in each bag counted. After removing the weight of the bag, an average weight per frog could be calculated and used for statistical analyses.
2.3 Statistical methods
Two way-ANOVA where conducted with the statistical program R. Trend lines and standard errors were created with Microsoft Excel 2013. Since pond 5 was contaminated with eggs from wild frogs, only 15 ponds were used in the statistical analyses. Therefore, Warm, NonDOC ponds only contained three replicates in all analyses. Some P-values were marginally insignificant, with a P-values close to 0.05. These will still be brought up and discussed due to the low of number of replicates.
3 Results
The frogs emerged at different times depending on the pond they lived in. 50% of the total number of emerged frogs in the Warm, DOC-pond had emerged 9 days after the first frog emerged, whereas the Warm, Non-DOC-pond reached 50% emergent at day 10. The Cold, DOC-pond reached 50% at day 17, and the Cold, Non-DOC-pond reach 50% at day 21 (figure 2 and figure 3).
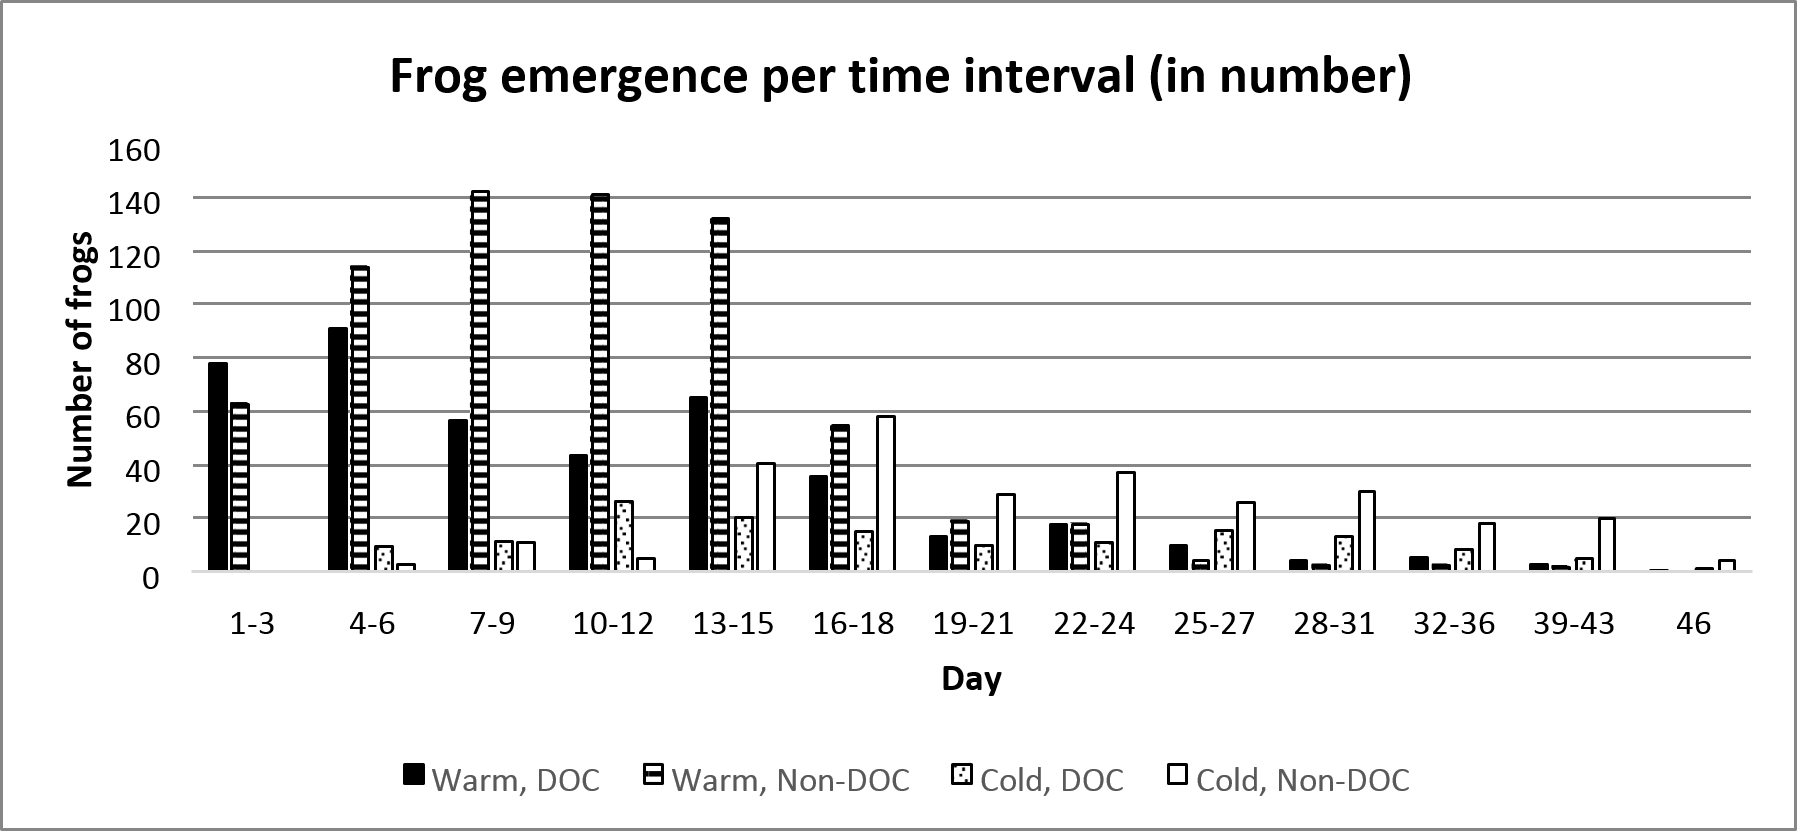
Figure 2. Frequency of average number of emerging frogs per treatment combination. Day 1 represent the first day which frogs emerged, which was the 14th of June.
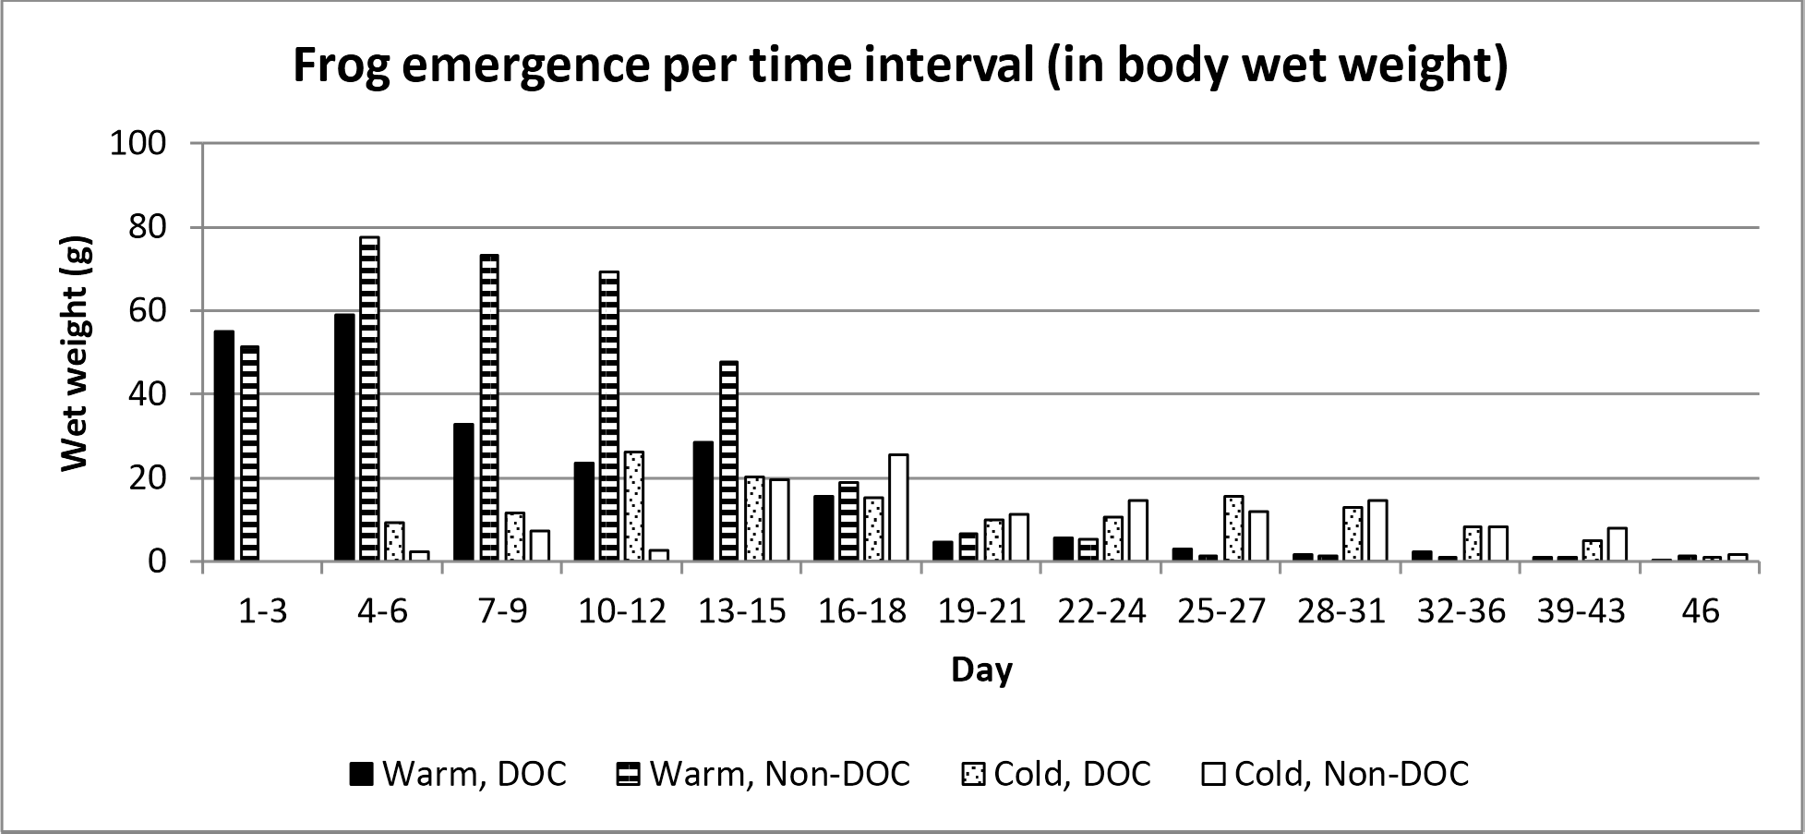
Figure 3. Frequency of average emerged weight per pond treatment. Day 1 represent the first day which frogs emerged, which was the 14th of June.
The average weight of individual frogs for all treatments was higher at the beginning of the emergence period, decreased over time, but increased again at the end of the emergence period (figure 4).
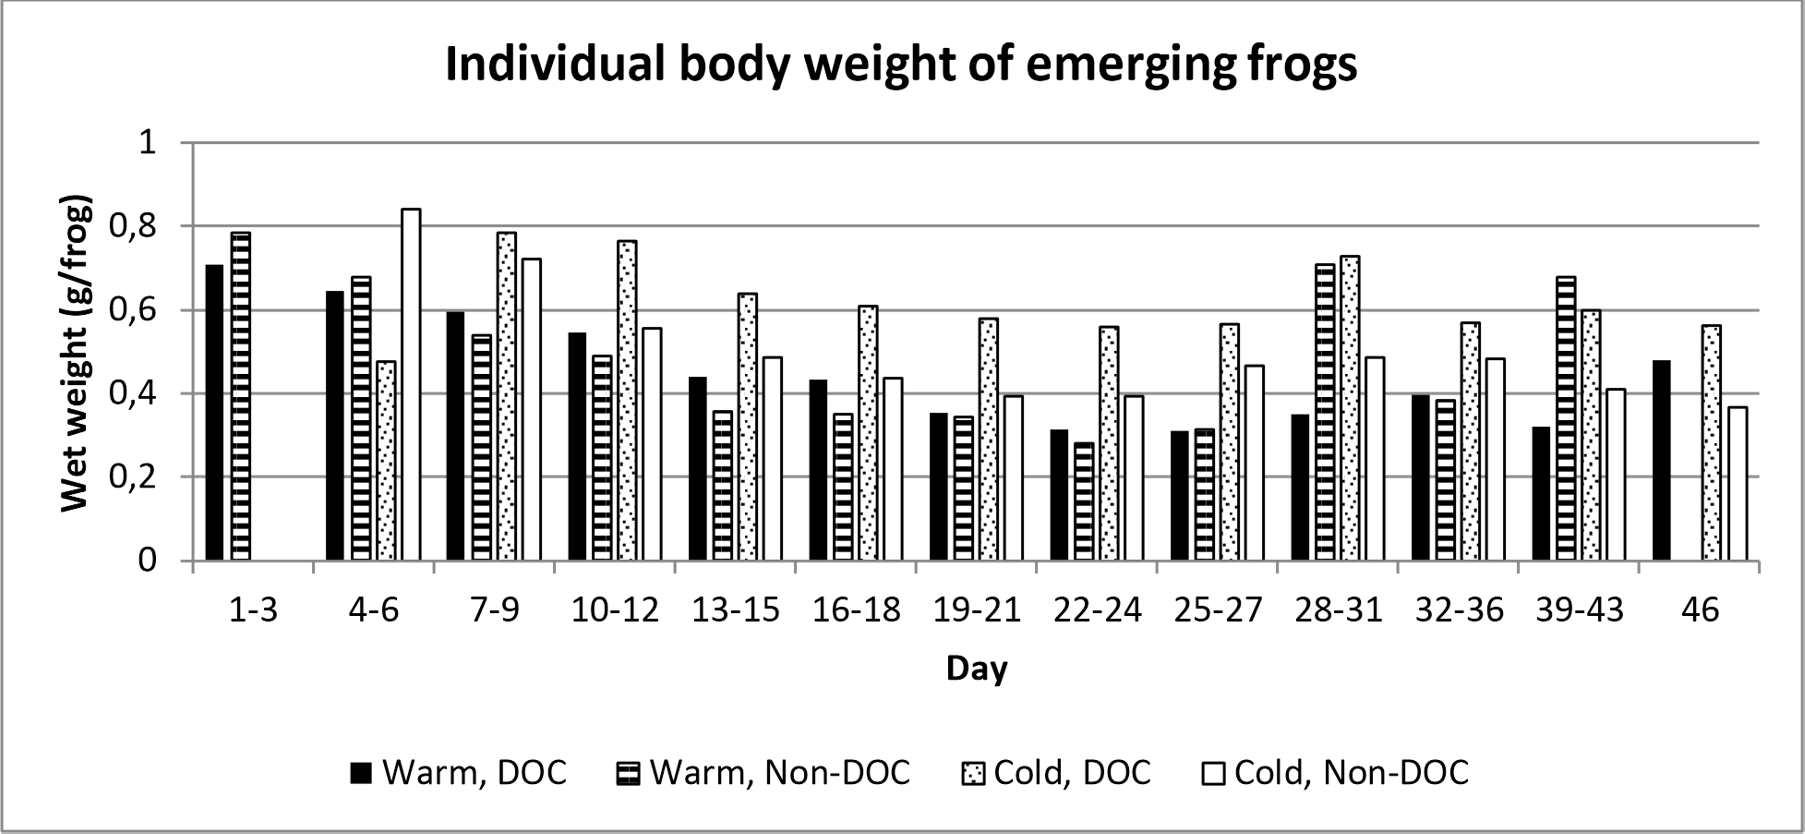
Figure 4. Frequency distribution of individual body weight per treatment combination per time interval. Day 1 represent the first day which frogs emerged, which was the 14th of June.
The individual body weight of emerging frogs are marginally insignificantly smaller in the warm than in the cold ponds. The body weight were also larger in the Cold, DOC- ponds compared to the Cold, Non-DOC-ponds. No such correlation could be found in the warm ponds, which shows that there is a significant interaction factor (figure 5 and table 1).
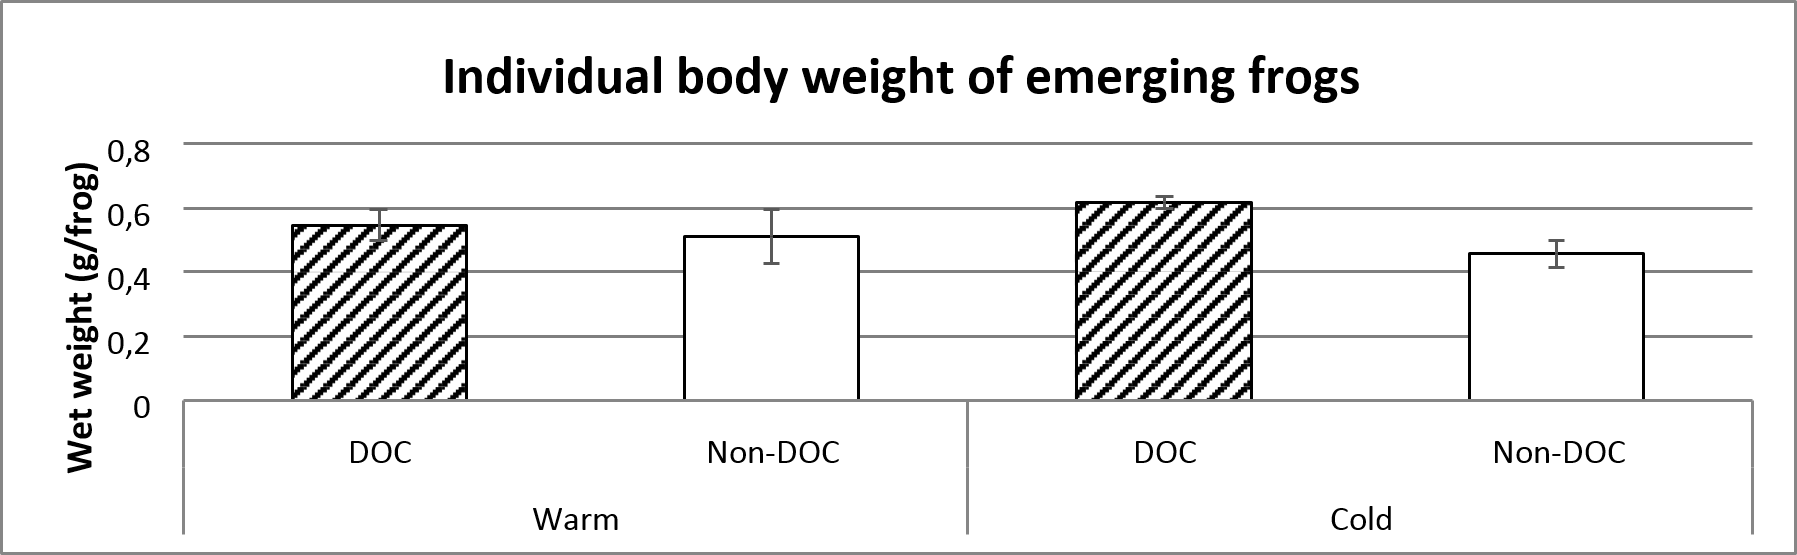
Figure 5. Average body weight of emerging frogs categorized by each pond type. The average value includes the entire sampling (14th of June to 29th of July). Error bars show standard error.
There is a significant differences in development rate between the warm and cold ponds, where the frogs in the cold ponds have a lower rate of development. The development time is marginally insignificantly different depending on the amount of emerged frogs (figure 6 and table 1).
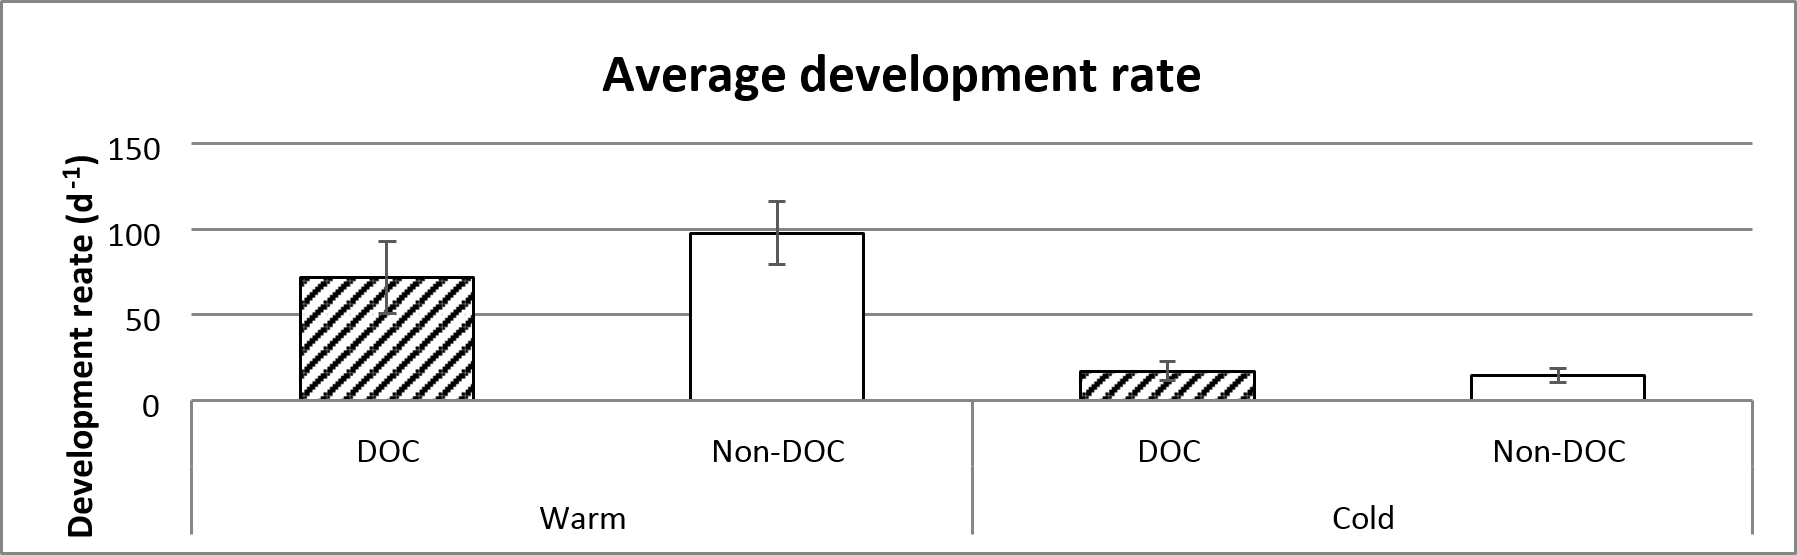
Figure 6. Average development rate of the different treatments, based on the entire sampling (14th of June to 29th of July). Error bars show standard error.
It emerged marginally insignificantly more frogs in the warm ponds than the cold. There is a clear significant difference between the warm and the cold ponds in regards to the weight of frog emergence, where the warm ponds had a higher total weight of emergent frogs (figure 7, figure 8 and table 2).
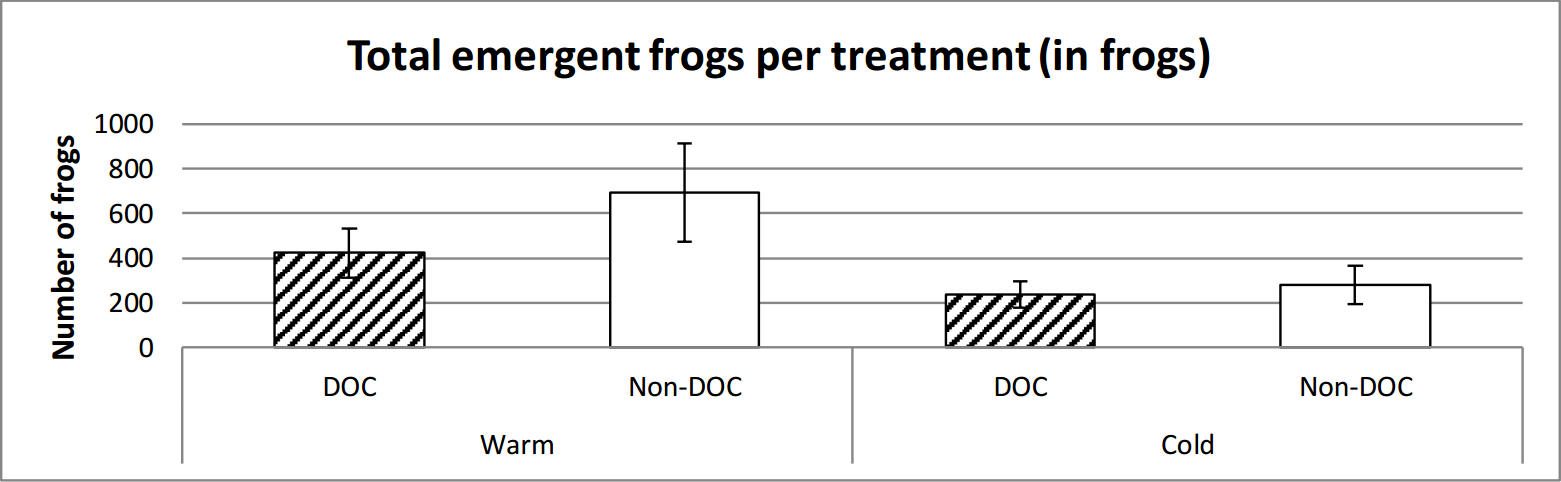
Figure 7. Average number of frogs emerged from the different types of ponds over the entire time of emerging (14th June to 29th of July). Error bars show standard error.
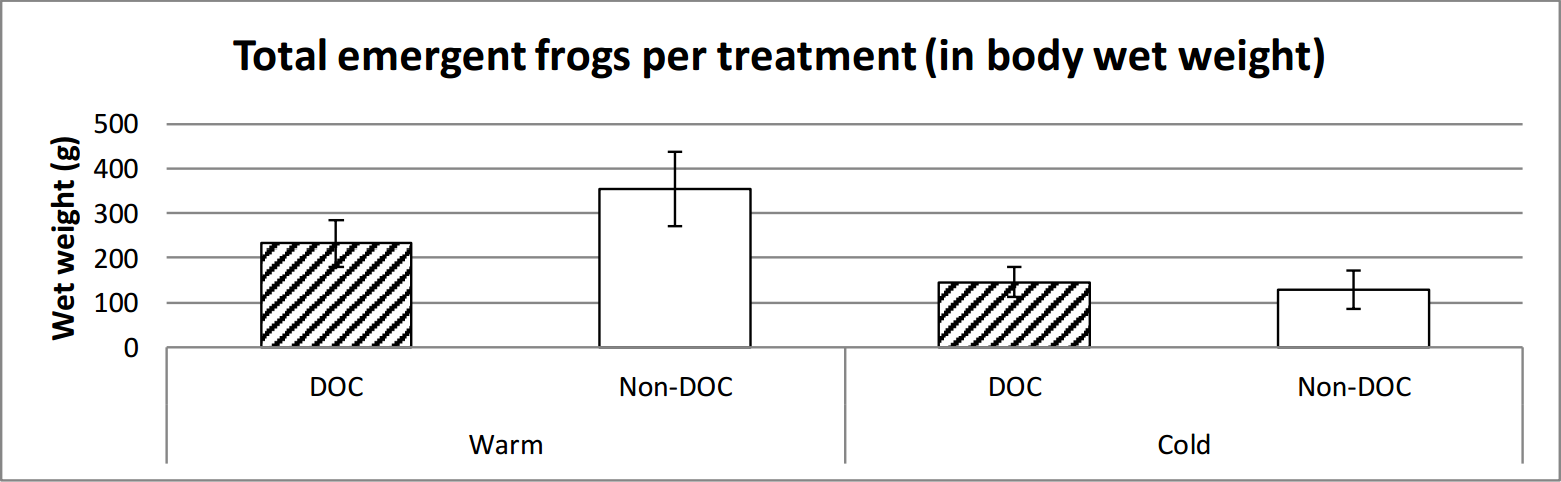
Figure 8. Average weight emerged from the different types of ponds over the entire time of emerging (14th June to 29th of July). Error bars show standard error.
A visible negative trend between the number of emerged frog and the average weight per frog is present within treatments (figure 9 and table 1).
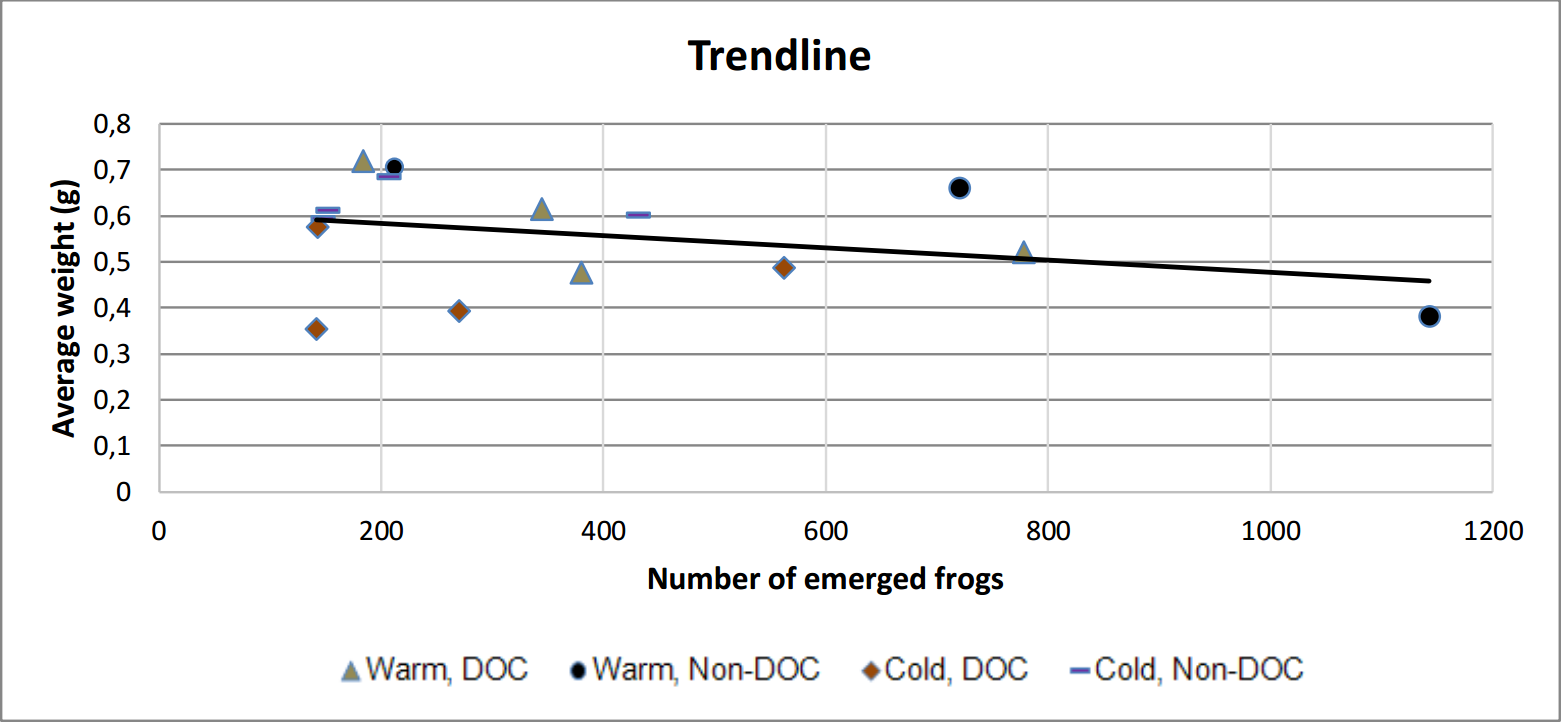
Figure 9. Scatter plot with trend line showing that the average weight decline with a larger amount of frogs.
Table 1. P-values from a general linear model, where average development rate and average emergence weight of individuals are tested against two categorical predictors, temperature and DOC, and one co-variate, the total number of emerging frogs.
| General linear model | Degr. of - Freedom | Avg. dev rate - p | Avg. emergence weight of individuals (g) - p |
|
|---|---|---|---|---|
| Total emergence (nr) | Continous predictor Co-variates | 1 | 0.092339 | 0.037152 |
| Temp | Categorical predictor | 1 | 0.000072 | 0.062321 |
| DOC | Categorical predictor | 1 | 0.737725 | 0.371239 |
| Temp*DOC | Interaction | 1 | 0.277205 | 0.041597 |
Table 2. P-values from from a 2-way ANOVA where total emergence of frogs, both in weight and number, are tested against temperature and DOC.
| 2-way ANOVA | Degr. of - Freedom | Total emergence (g) - p | Total emergence (nr) - p |
|---|---|---|---|
| Temp | 1 | 0.028589 | 0.057038 |
| DOC | 1 | 0.426936 | 0.292074 |
| Temp*DOC | 1 | 0.270218 | 0.427322 |
4 Discussions
Tadpole-development occurred at a much higher rate in the warm ponds than the cold, which seems both reasonable and predictable since chemical reactions occur at a greater speed at a higher temperature (figure 6). It also fits the metabolic theory of ecology. It also seems reasonable to expect that the frogs which emerged earlier have a lesser weight as newly metamorphosed individuals, since they accumulated less energy before emerging. However, the difference in the weight of individuals did not differ unanimously (one category of cold ponds did not differ from one warm category). This could be explained by the difference in total amount of emerged frogs from each category. As seen in figure 9, there's a trend between the amount of emerged frog and the average weight. This could lead to a statistical interference, since some frogs were lighter just because they had more frogs than other ponds, and not because of the water treatments.
The level of DOC also affected the tadpoles, more specifically the emerging weight of individual frogs, where Cold/DOC ponds resulted in heavier frogs than Cold/Non-DOC ponds. The interesting part is that it only seems to affect the individuals in the cold ponds (figure 5). I am drawing the conclusion that this occurs since the tadpoles in the warm ponds are simply present in the DOC-rich water a shorter amount of time, and are therefore not given time enough time to be affected by the DOC.
The general pattern of the average weight of individuals decreasing over time, in order to rise again later, could be explained by simple competition and the fact that the relatively small ponds have a low carrying capacity. In other words, the tadpoles are growing to their full capacity at the beginning of the experiment. After a while, they start to feel the effect of intraspecific competition and perhaps become food limited. When some start to emerge, the pressure of the competition lessens, which once again results in heavier individuals when they emerge.
It is clear that future climate change will affect anurans extensively, even in a northern boreal forest, far away from the hotspots of the tropics. The question is, how will it affect them in a longer time-span than just tadpole to young frog? Could a lower weight of newly metamorphosed individuals, as a consequence of a warmer climate, decrease the general fitness of frogs? Perhaps they will not be strong enough to ensure that they'll survive the winter, or simply be an easier target for predators, due to lack of energy. These are just some of the many questions which need answering. It is therefore highly advised that studies continue to target the ecology and biology of amphibians, especially in this time of global extinction which we are living in today.
References
Alford, R. J. 2011. Bleak future for amphibians. Nature, 480:461-462.
Bernes, C. 2007. En ännu varmare värld. Naturvårdsverket, Stockholm. 176 sidor.
Collins, J. P. and Crump, M. L. 2009. Extinction in our times: global amphibian decline. Oxford university press, USA. 304 sidor.
Gosner, K. L. 1960. A simplified table for staging anuran embryos and larvae with notes on identification. Herpetologica 16: 183-190.
Laudon, H., Tetzlaff, D., Soulsby, C., Carey, S., Seibert, J., Buttle, J., Shanley, J., McDonell, J.J. and McGuire, K. 2013. Change in winter climate will affect dissolved organic carbon and water fluxes in mid-to-high latitude catchments. Hydrological processes, 27:700-709.
Tian, Y.Q., Yu, Q., Feig A.D., Ye, C.J. and Blunden, A. 2013. Effects of climate and landsurface processes on terrestrial dissolved organic carbon export to major US coastal rivers. Ecologial engineering, 54:192-201.
Wells, D, W. 2007. The Ecology and Behavior of Amphibians. The University of Chicago Press, USA. 1148.
 Artikel skriven av:
 Kunde inte slutföra åtgärden eftersom du har blivit utloggad.